Accounting
Anthropology
Archaeology
Art History
Banking
Biology & Life Science
Business
Business Communication
Business Development
Business Ethics
Business Law
Chemistry
Communication
Computer Science
Counseling
Criminal Law
Curriculum & Instruction
Design
Earth Science
Economic
Education
Engineering
Finance
History & Theory
Humanities
Human Resource
International Business
Investments & Securities
Journalism
Law
Management
Marketing
Medicine
Medicine & Health Science
Nursing
Philosophy
Physic
Psychology
Real Estate
Science
Social Science
Sociology
Special Education
Speech
Visual Arts
Question
At a sawmill in Oregon, a process improvement team measured the diameters for a sample of 1,500 logs. The following summary statistics were computed:
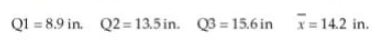
Given this information, for a box and whisker plot which of the following statements is appropriate?
A) Seventy-five percent of the trees in the sample have values between 8.9 in. and 15.6 in.
B) Virtually all of the data should fall between 0 in. and 25.65 in.
C) No tree will have a diameter of more than 22.3 in.
D) Fifty percent of the trees will have diameters between 13.5 in. and 15.6 in.
Answer
This answer is hidden. It contains 10 characters.
Related questions
Q:
One of the major challenges for developing a good written questionnaire or telephone survey instrument is that:
A) nonresponses are too high.
B) there will always be missed data.
C) bias cannot be controlled.
D) wording can influence responses.
Q:
A consumer products company wants to interview customers regarding a new product. If it wishes to adhere to a predetermined pattern of questions in the interview, which of the following would likely be used?
A) Structured interview
B) Open-end questioning
C) Unstructured interview
D) Written questionnaire
Q:
Which of the following types of questions provide the respondent with the greatest choice in responding to a question?A) Open-end questionsB) Close-end questionsC) Multiple choice questionsD) True/false questions
Q:
Based on a survey of 400 students in a university in which 20 percent indicated that they were business majors. The university student newspaper reported that "20 percent of all the students at the university are business majors." This report is an example of:
A) a sample.
B) a population.
C) statistical inference.
D) descriptive statistics.
Q:
The company that makes a new weight loss pill claims that people who use this pill according to instructions will lose an average of 20 pounds during a four-month period. They say the claim is based on a study of 300 people. Which of the following statistical methods was most likely used to arrive at the company's conclusion?
A) Estimation
B) Hypothesis testing
C) Histograms
D) Bar charts
Q:
Estimation and hypothesis testing are categories of:
A) inferential statistics.
B) descriptive statistics.
C) numerical measurement.
D) statistical charts.
Q:
The Biltmore Hotel manager is getting ready to make a presentation that she hopes will justify adding additional staff. As part of the presentation, she has constructed charts and graphs. The general type of statistical analysis she is using is:
A) hypothesis testing.
B) estimation.
C) inferential statistics.
D) descriptive statistics.
Q:
Which of the following is an example of graphs used to describe data?
A) Histograms
B) Bar charts
C) Both A and B are correct.
D) None of the above.
Q:
A cell phone service provider has 14,000 customers. Recently, the sales department selected a random sample of 400 customer accounts and recorded the number of minutes of long distance time used during the previous billing period. The company analyst used Excel to sort these values in order from high to low. She then assigned the highest value a rank of 1, the next highest value a rank of 2, and so forth. These ranks would be considered to be ordinal data.
Q:
A major fast-food chain has installed a device that measures the temperature of the hamburgers on the grill. These data are stored in a computer file. If you were to analyze these data, you would be working with ordinal level data.
Q:
A variable, i.e., the length of time it takes for an employee to complete an assembly procedure at an automotive plant, is a ratio level variable.
Q:
Nominal data is the highest level of data.
Q:
Recording vehicle type as sedan, minivan, pick-up truck, etc. is an example of qualitative data.
Q:
Sales data measured each week for the past twenty weeks are examples of time-series data.
Q:
It is possible for the same survey questionnaire to yield both quantitative and qualitative data.
Q:
One of the most common statistical sampling techniques is convenience sampling.
Q:
If an analyst computes statistics from a sample, the sample is by definition a statistical sample.
Q:
Statistics are measures computed from the entire population of data.
Q:
Population parameters are descriptive numerical measures, such as an average, that describe the entire population.
Q:
Data gathered from a structured interview is generally easier to analyze than data collected from an unstructured interview.
Q:
Data collected using open-end questions is generally easier to analyze than data collected from closed-end questions.
Q:
A major issue facing many states is whether to legalize casino gambling. Suppose the governor of one state believes that more than 55% of the state's registered voters would favor some form of legal casino gambling. However, before backing a proposal to allow such gambling, the governor has instructed his aides to conduct a statistical test on the issue. To do this, the aides have hired a consulting firm to survey a simple random sample of 300 voters in the state. Of these 300 voters, 175 actually favored legalized gambling.
Assuming that a significance level of 0.05 is used, what conclusion should the governor reach based on these sample data?
A) Since z = 1.1594 < 1.645, do not reject the null hypothesis.
The sample data do not provide sufficient evidence to conclude that more than 55 percent of the population favor legalized gambling.
B) Since z = 2.1316 > 1.645, reject the null hypothesis.
The sample data provide sufficient evidence to conclude that more than 55 percent of the population favor legalized gambling.
C) Since z = 1.1594 < 1.645, do not reject the null hypothesis.
The sample data do not provide sufficient evidence to conclude that more than 58 percent of the population favor legalized gambling.
D) Since z = 2.1316 > 1.645, reject the null hypothesis.
The sample data provide sufficient evidence to conclude that more than 58 percent of the population favor legalized gambling.
Q:
For the following hypothesis test:With n= 64 and p= 0.42, state the decision rule in terms of the critical value of the test statisticA) The decision rule is: reject the null hypothesis if the calculated value of the test statistic, z, is greater than 2.013 or less than -2.013. Otherwise, do not reject.B) The decision rule is: reject the null hypothesis if the calculated value of the test statistic, z, is less than 2.013 or greater than -2.013. Otherwise, do not reject.C) The decision rule is: reject the null hypothesis if the calculated value of the test statistic, z, is greater than 2.575 or less than -2.575. Otherwise, do not reject.D) The decision rule is: reject the null hypothesis if the calculated value of the test statistic, z, is less than 2.575 or greater than -2.575. Otherwise, do not reject.
Q:
At a recent meeting, the manager of a national call center for a major Internet bank made the statement that the average past-due amount for customers who have been called previously about their bills is now no larger than $20.00. Other bank managers at the meeting suggested that this statement may be in error and that it might be worthwhile to conduct a test to see if there is statistical support for the call center manager's statement. The file called Bank Call Center contains data for a random sample of 67 customers from the call center population. Assuming that the population standard deviation for past due amounts is known to be $60.00, what should be concluded based on the sample data? Test using α = 0.10.
A) Because p-value = 0.4121 > alpha = 0.10, we do not reject the null hypothesis.
The sample data do not provide sufficient evidence to reject the call center manager's statement that the mean past due amount is $20.00 or less.
B) Because p-value = 0.4121 > alpha = 0.10, we reject the null hypothesis.
The sample data provide sufficient evidence to reject the call center manager's statement that the mean past due amount is $20.00 or less.
C) Because p-value = 0.2546 > alpha = 0.10, we do not reject the null hypothesis.
The sample data do not provide sufficient evidence to reject the call center manager's statement that the mean past due amount is $20.00 or less.
D) Because p-value = 0.2546 > alpha = 0.10, we reject the null hypothesis.
The sample data provide sufficient evidence to reject the call center manager's statement that the mean past due amount is $20.00 or less.
Q:
The director of a state agency believes that the average starting salary for clerical employees in the state is less than $30,000 per year. To test her hypothesis, she has collected a simple random sample of 100 starting clerical salaries from across the state and found that the sample mean is $29,750. Assuming the population standard deviation is known to be $2,500 and the significance level for the test is to be 0.05, what is the critical value (stated in dollars)?
A) For alpha = .05 and a one tailed, lower tail test, the critical value is z = -1.645. Solving for the critical x-bar: -1.645 = (x-bar - 30,000)/250, x-bar = $29,588.75
B) For alpha = .05 and a one tailed, lower tail test, the critical value is z = -1.96. Solving for the critical x-bar: -1.96 = (x-bar - 30,000)/250, x-bar = $34,211.14
C) For alpha = .05 and a one tailed, lower tail test, the critical value is z = -1.645. Solving for the critical x-bar: -1.645 = (x-bar - 30,000)/250, x-bar = $34,211.14
D) For alpha = .05 and a one tailed, lower tail test, the critical value is z = -1.96. Solving for the critical x-bar: -1.96 = (x-bar - 30,000)/250, x-bar = $30,411.25
Q:
For the following hypothesis:A) Because the computed value of t = 0.78 is not greater than 2.1727, reject the null hypothesis.B) Because the computed value of t = 0.78 is not greater than 2.1727, do not reject the null hypothesis.C) Because the computed value of t = 0.78 is not greater than 1.3277, reject the null hypothesis.D) Because the computed value of t = 0.78 is not greater than 1.3277, do not reject the null hypothesis.
Q:
For the following hypothesis:A) 1.58B) 0.78C) 1.14D) 0.41
Q:
For the following hypothesis test:A) Reject the null hypothesis if the calculated value of the test statistic, z, is greater than the critical value of the test statistic, 1.645. Otherwise, do not reject.B) Reject the null hypothesis if the calculated value of the test statistic, z, is greater than the critical value of the test statistic, 2.05. Otherwise, do not reject.C) Accept the null hypothesis if the calculated value of the test statistic, z, is greater than the critical value of the test statistic, 1.645. Otherwise, do not accept.D) Accept the null hypothesis if the calculated value of the test statistic, z, is greater than the critical value of the test statistic, 2.05. Otherwise, do not accept.
Q:
A contract calls for the mean diameter of a cylinder to be 1.50 inches. As a quality check, each day a random sample of n = 36 cylinders is selected and the diameters are measured. Assuming that the population standard deviation is thought to be 0.10 inch and that the test will be conducted using an alpha equal to 0.025, what would the probability of a Type II error be?
A) Approximately 0.1267
B) About 0.6789
C) 0.975
D) Can't be determined without knowing the "true" population mean.
Q:
When developing a confidence interval estimate, the confidence level is calculated based on the size of the sample and the population standard deviation.