Accounting
Anthropology
Archaeology
Art History
Banking
Biology & Life Science
Business
Business Communication
Business Development
Business Ethics
Business Law
Chemistry
Communication
Computer Science
Counseling
Criminal Law
Curriculum & Instruction
Design
Earth Science
Economic
Education
Engineering
Finance
History & Theory
Humanities
Human Resource
International Business
Investments & Securities
Journalism
Law
Management
Marketing
Medicine
Medicine & Health Science
Nursing
Philosophy
Physic
Psychology
Real Estate
Science
Social Science
Sociology
Special Education
Speech
Visual Arts
Question
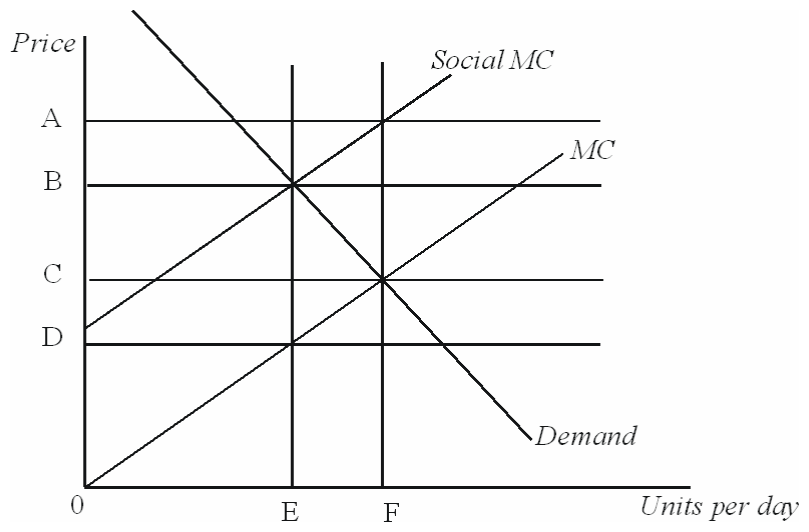
Refer to the figure above. This graph describes a production process that:
A. generates positive externalities.
B. is used by a perfectly competitive industry.
C. generates negative externalities.
D. has been negotiated using the Coase Theorem approach.
Answer
This answer is hidden. It contains 109 characters.

Related questions
Q:
Refer to the table above. Pat's opportunity cost of the delivery of an extra pizza is the production of _____ pizza(s).A. 12B. 10C. 3/2D. 2/3
Q:
Larry has a comparative advantage in writing a term paper if he: A. can write a paper faster than the other students in class.
B. has an absolute advantage in writing a term paper.
C. always earns an A on his papers.
D. has the lowest opportunity cost for writing a term paper.
Q:
If Scout has an absolute advantage over Dill: A. Scout has more money than Dill.
B. the problem of scarcity applies to Dill, but not to Scout.
C. the problem of scarcity applies to Scout, but not to Dill.
D. Scout can accomplish more in a given period of time than can Dill.
Q:
A job is most likely to be outsourced if it: A. involves face-to-face contact.
B. cannot be done by a computer.
C. does not require complex communication.
D. does not require use of computers or other technology.
Q:
It was expected that consumers in _____ would benefit from reduced prices of goods that will be freely traded under the NAFTA. A. Canada
B. the United States
C. China
D. Mexico
Q:
NAFTA helped ______ to exploit a comparative advantage in the production of goods made by unskilled labor. A. Canada
B. Cuba
C. Mexico
D. The USA
Q:
Large developed countries can produce more of practically everything than can small, less developed countries. Which of the following statements is true? A. The large country has no incentive to trade with the smaller country.
B. It would be impossible for the smaller country to have a comparative advantage in making any products that the larger country wants to buy.
C. Trade will benefit both countries if each country has a comparative advantage in a traded product.
D. Trade between the countries is more likely to benefit the small country and harm the larger country.
Q:
Between the U.S. and Nepal, Nepal invests less in new factories and equipment. This will likely cause: A. Nepal's production possibilities curve to shift outward faster than the U.S.'s.
B. The U.S.'s production possibilities curve to shift inward faster than Nepal's.
C. The U.S.'s production possibilities curve to shift outward faster than Nepal's.
D. Nepal's production possibilities curve to shift inward faster than the U.S's.
Q:
Which of the following statements is NOT true about specialization? A. Total economic output is larger due to specialization.
B. After specialization, worker skills are better matched with tasks.
C. Specialization focuses experience and increases comparative advantage.
D. The variety of tasks associated with a particular job grows over time due to specialization.
Q:
The cost-benefit principle indicates that an action should be taken: A. if the total benefits exceed the total costs.
B. if the average benefits exceed the average costs.
C. if the net benefit (benefit minus cost) is zero.
D. if the extra benefit is greater than or equal to the extra costs.
Q:
Refer to the table above. The Chairman of the Economics Department at What's AMatterU says that fundraisers should be hired as long as their marginal donations exceed their marginal labor costs. Following this criterion, __________ employees are hired and net benefits are __________.A. 1; $22,000B. 2; $25,426C. 3; $25,426D. 2; $3,476
Q:
Refer to the table above. The marginal labor cost (extra labor cost) of the 4th employee is:A. $9,500.B. $10,750.C. $11,000.D. $13,000.
Q:
Refer to the table above. According to the cost-benefit principle, the level of activity that provides the largest net benefit is:A. 1B. 4C. 5D. 7
Q:
Refer to the table above. The average benefit of 4 units of activity is:A. $4B. $5C. $6D. $10
Q:
You save $10 on gas every week since you live close to the bus stop. You have class five days a week. What is your average benefit per day for living close to the bus stop? A. $10
B. $5
C. $2
D. $1.43
Q:
The extra benefit that comes from an extra unit of activity is called the _________ of the activity. A. marginal benefit.
B. marginal cost.
C. average benefit.
D. reservation benefit.
Q:
Suppose a person makes a choice that seems inconsistent with the cost-benefit principle. Which of the following statements represents the most reasonable conclusion to draw? A. The person (explicitly or implicitly) over-estimated the benefits or under-estimated the costs or both.
B. The cost-benefit principle is rarely true.
C. The person does not grasp how decisions should be made.
D. The person is simply irrational.
Q:
Janie must either mow the lawn or wash clothes, earning her a benefit of $30 or $45, respectively. She dislikes both equally and they both take the same amount of time. Janie will therefore choose to _________ because the economic surplus is ________. A. mow the lawn; greater
B. wash clothes; greater
C. mow the law; smaller
D. wash clothes; smaller
Q:
A rational person is one who: A. is reasonable.
B. makes choices that are easily understood.
C. possesses well-defined goals and seeks to achieve them.
D. is highly cynical.
Q:
Some states have started giving tax credits to homeowners who install solar panels. This is an example of: A. A decision pitfall because homeowners will not properly account for the costs and benefits of installing solar panels.
B. Using the incentive principle to encourage homeowners to switch to solar energy.
C. Normative economics, because people should use clean sources of energy.
D. Macroeconomic policy because it involves government tax policy.
Q:
Last year interest rates fell. The field of economics that would be most concerned with this is: A. microeconomics.
B. macroeconomics.
C. economic naturalism.
D. marginal economics.
Q:
In deciding the number of guitars to buy for his shop before the Christmas season, Mark is making a(n) __________________ decision. A. microeconomic
B. macroeconomic
C. economic surplus
D. marginal choice
Q:
Which of the following questions would not be answered in macroeconomics? A. What caused the great depression?
B. At what rate does the US economy typically grow?
C. Did the sharp increase in gasoline prices alter SUV sales?
D. How does government spending affect the economy?
Q:
Which of the following would not be analyzed in microeconomics? A. How to make the largest profit?
B. Whether to study or watch TV tonight.
C. How an early freeze in California will affect the price of fruit?
D. Whether the federal budget should always be balanced.
Q:
The incentive principle states that a person is more likely to do something if: A. the opportunity costs are high.
B. the benefits from doing it increase.
C. everyone else is doing the same thing.
D. he is paid to do it.
Q:
An editorial in the paper argues that students should only be allowed to attend school so long as the marginal cost of educating that student is less than the marginal benefit of that student's education. The writer's reasoning is an application of: A. positive economics.
B. negative economics.
C. normative economics.
D. economic naturalism.
Q:
Positive economic principles are those that:A. are always correct.B. are influenced by political ideology.C. predict how people should behave.D. predict how people will behave.
Q:
Refer to the figure above. What is the price elasticity of supply at point B and C? A. 1/2; 3/4
B. 3/4; 1/2
C. 3; 2
D. 1; 1
Q:
An increase in the price of golf clubs from $75 to $125 led to an increase in quantity supplied from 200 units to 300 units. The price elasticity of supply for golf club is _____ so the supply curve is _______. A. 2; elastic
B. 2; inelastic
C. 4/3; elastic
D. 3/4; inelastic
Q:
If you consume less of a good as your income increases: A. your demand curve is not downward sloping for that good.
B. the good must be an inferior good.
C. the good must not have any close substitutes.
D. your quantity demanded changed by a movement along the demand function.