Accounting
Anthropology
Archaeology
Art History
Banking
Biology & Life Science
Business
Business Communication
Business Development
Business Ethics
Business Law
Chemistry
Communication
Computer Science
Counseling
Criminal Law
Curriculum & Instruction
Design
Earth Science
Economic
Education
Engineering
Finance
History & Theory
Humanities
Human Resource
International Business
Investments & Securities
Journalism
Law
Management
Marketing
Medicine
Medicine & Health Science
Nursing
Philosophy
Physic
Psychology
Real Estate
Science
Social Science
Sociology
Special Education
Speech
Visual Arts
Question
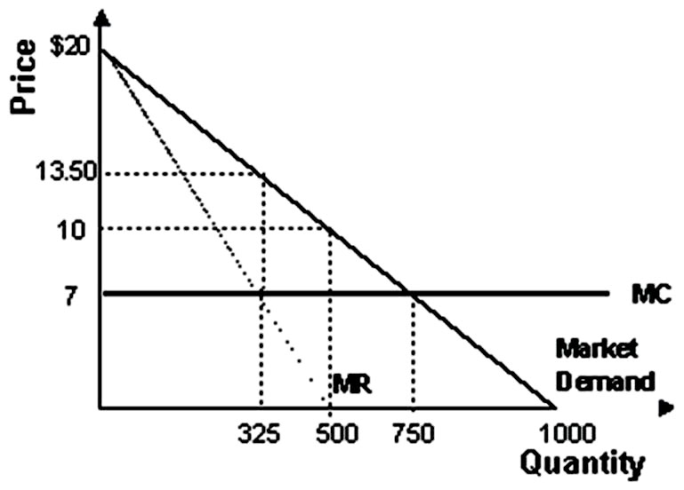
Refer to the graph shown. If this graph represents a monopoly market, the equilibrium price and quantity will be:
A. $13.50 and 325, respectively.
B. $7 and 325, respectively.
C. $10 and 500, respectively.
D. $7 and 750, respectively.
Answer
This answer is hidden. It contains 126 characters.

Related questions
Q:
High gasoline prices hit commuters who live far from their jobs in areas with little public transportation hard. With few alternatives, they just have to bear the higher cost. Based on this information, how would you characterize demand for gasoline by these commuters? A. Gasoline is a luxury good.
B. Gasoline is an inferior good.
C. Demand for gasoline is elastic.
D. Demand for gasoline is inelastic.
Q:
If quantity demanded changes infinitely when the price changes, the demand: A. is slightly elastic.
B. is inelastic.
C. is unit elastic.
D. is perfectly elastic.
Q:
If the percentage increase in the quantity supplied is greater than the percentage increase in the price, the supply: A. is elastic.
B. is inelastic.
C. is unit elastic.
D. is perfectly elastic.
Q:
If the supply of a product is inelastic, this implies that a specific percentage change in price leads to:A. an equal percentage change in the quantity supplied.B. a larger percentage change in the quantity supplied.C. a smaller percentage change in the quantity supplied.D. no percentage change in the quantity supplied.
Q:
Refer to the graph shown. The elasticity of demand is closest to 1 on line segment:A. AB.B. BC.C. CD.D. The elasticity is not close to 1 on any of these line segments.
Q:
Government may not have an incentive to correct a market failure because: A. government doesn't have the information it needs to correct the market failure.
B. government reflects politics, which reflects individuals' interests in trying to gain more for themselves.
C. policy makers fear that intervention will lead to a Pareto optimal outcome.
D. the benefit of correcting the market failure might exceed the cost of correcting the market failure.
Q:
All of the following are justifications for government intervention except: A. too much competition.
B. informational problems.
C. externalities.
D. public goods.
Q:
Opponents of government intervention argue that government makes decisions based on: A. marginal social costs and marginal social benefits.
B. marginal political costs and marginal political benefits.
C. irrational choices.
D. total costs and total benefits.
Q:
Which of the following is an example of screening? A. Selling pollution permits to polluters to induce the lowest-cost pollution reducers to cut back on pollution
B. Reducing pollution to the point at which the marginal cost of the pollution equals the marginal benefit
C. A car buyer asking the seller if the car is a lemon
D. An employer requiring job applicants to provide references
Q:
A life insurance company is likely to require a health examination of a person applying for insurance. This helps reduce the informational problem through the process of: A. signaling.
B. screening.
C. creating an externality.
D. government regulation.
Q:
Some economists believe that the market will not solve all problems. They are referring to: A. market failure.
B. market incentive plans.
C. optional policy.
D. the need to balance the good of the individual with the good of society as a whole.
Q:
Adverse selection problems can occur when buyers and sellers have different amounts of information about a good for sale.
Q:
If 1 Canadian dollar costs 0.60 U.S. dollar, 1 U.S. dollar costs: A. 0.40 Canadian dollar.
B. 0.60 Canadian dollar.
C. 1.40 Canadian dollars.
D. 1.67 Canadian dollars.
Q:
One of the 10 sources of U.S. comparative advantage mentioned in the text is: A. religious diversity.
B. a large military.
C. a high ratio of lawyers to the population.
D. stable U.S. government institutions.
Q:
In the United States globalization has: A. played a significant role in growing income disparity because some sectors have benefited and others have not.
B. played little role in growing income disparity because all Americans are consumers who have enjoyed lower prices.
C. played a significant role in growing income disparity because foreign workers' incomes have risen.
D. played little role in growing income disparity because while some jobs were lost, the gain in jobs balanced out those that were lost.
Q:
More than 10,000 visitors waited up to two hours in line to see the rare flower titan arum at the Cambridge Botanical Gardens. What does this situation illustrate to an economist about rationing?A. Goods don't have to be rationed by lottery or first-come, first-served. Goods can be rationed by price.B. When goods are not fully rationed by price, other rationing mechanisms such as waiting arise.C. When goods are not rationed by price, other rationing mechanisms such as lottery must be introduced.D. There is no need for rationing if anyone who waits long enough can see the flower.
Q:
If it takes you an hour to make a rational decision and the opportunity cost of that hour is $100, you will: A. always make rational decisions.
B. make rational decisions only if the benefit from doing so exceeds $100.
C. make rational decisions only if the benefit from doing so is less than $100.
D. never make rational decisions.
Q:
Your opportunity cost of taking this course is: A. the tuition you paid for the course.
B. the net benefit of the activity you would have chosen if you had not taken the course.
C. the net benefit of taking this course.
D. the cost of the activity you would have chosen if you had not taken the course.
Q:
The marginal benefit of going to a movie during the week is currently $6 for you. Assume that the $4 price of going to the movies measures its marginal cost. Following the economic decision rule, you will: A. continue going to movies until the marginal benefit of doing so falls to zero.
B. choose not to go to any movies during the week.
C. continue going to movies until the marginal benefit of doing so falls below $4.
D. not be able to enjoy a net gain from going to the movies during the week.
Q:
Which of the following best defines rational behavior? A. Analyzing the total gains from a decision
B. Improving net gain by pursuing decisions as long as the marginal benefits exceed the marginal costs
C. Seeking to gain by choosing to undertake actions as long as the marginal costs exceed the associated marginal benefits
D. Seeking to maximize total gain regardless of cost
Q:
The table below shows how the marginal benefit of videotape rentals varies for Carol with the number rented per month. The price of each tape rental is reduced from $2.99 to $1.99. Assuming that the price of a rental accurately reflects the marginal cost to Carol and that she is rational, she will increase the number of tapes rented per month from: A. one to two.
B. two to three.
C. three to four.
D. four to five.
Q:
Mary buys cell-phone services from a company that charges $30 per month. For that $30 she is allowed 600 minutes of free calls and then pays 25 cents per minute for any calls above 600 minutes. Mary has used 600 minutes this month so far. What is her marginal cost per minute of making additional calls? A. 25 cents
B. 10 cents
C. 5 cents
D. Zero
Q:
Microsoft filed a lawsuit against people who sent spam (junk e-mail) and a website owner who hosted spam services. A spokesman for Microsoft said that Microsoft was "trying to change the economics of spam" by increasing the cost of being a spammer. An economist most likely would agree with which statement about Microsoft's actions? A. A more effective approach would be to educate spammers about the costs they impose on others.
B. A more effective approach would be to appeal to the morals of the spammers and tell them to follow the Golden Rule.
C. Microsoft's approach of trying to change the costs of spamming is the most effective way to change behavior.
D. Microsoft should not be involved because spamming is just part of the invisible hand at work and should be left alone.
Q:
Alexandra has determined that studying an hour for her economics quiz will improve her grade on the quiz from 75 to 100. She also determines that this improvement is worth $20. To study for an hour for her economics quiz, however, she will have to work one fewer hour at her part-time job. Alexandra should: A. study for the quiz as long as her hourly wage rate is less than $20.
B. study for the quiz as long as her hourly wage rate is more than $20.
C. study for the quiz only if her hourly wage rate is exactly $20.
D. not study for the quiz because earning a higher grade cannot have a dollar value.
Q:
More than 10,000 people waited in line for more than two hours to see a titan arum (a rare flower) at Cambridge's Botanic Garden. An economist would conclude that: A. people felt they got great benefit from seeing the flower.
B. people did not know that they should ignore sunk costs in reaching decisions.
C. some things do not have a cost because people do not have to pay for them.
D. social forces are sometimes more important than market forces.
Q:
The fact that the United States has a trade deficit means that: A. the United States is producing more than it is consuming.
B. foreign countries can have comparative advantages in all goods.
C. foreign countries can have comparative advantages in more goods compared to the United States.
D. the United States is lending more to foreign countries than it is borrowing from foreign countries.
Q:
Refer to the graph shown. Given these production possibility curves, you would suggest that: A. Country A should specialize in widgets and Country B in wadgets.
B. No trade should take place.
C. Country A should specialize in wadgets and Country B in widgets.
D. Both countries should produce an equal amount of each.
Q:
When a country runs a trade deficit, it does so by: A. borrowing from foreign countries or selling assets to them.
B. borrowing from foreign countries or buying assets from them.
C. lending to foreign countries or selling assets to them.
D. lending to foreign countries or buying assets from them.
Q:
If Americans suddenly wanted European products because they were deemed more fashionable, the: A. demand curve for the euro would shift right.
B. demand curve for the euro would shift left.
C. supply curve for the euro would shift right.
D. supply curve for the euro would shift left.
Q:
All of the following would cause the yen (currency of Japan) to appreciate except: A. the discovery of a vegetable only grown in Japan that could be used as biofuel.
B. increased interest rates on Japanese financial assets.
C. a decrease in Japanese income.
D. a new, global trend for Japanese sushi.