Accounting
Anthropology
Archaeology
Art History
Banking
Biology & Life Science
Business
Business Communication
Business Development
Business Ethics
Business Law
Chemistry
Communication
Computer Science
Counseling
Criminal Law
Curriculum & Instruction
Design
Earth Science
Economic
Education
Engineering
Finance
History & Theory
Humanities
Human Resource
International Business
Investments & Securities
Journalism
Law
Management
Marketing
Medicine
Medicine & Health Science
Nursing
Philosophy
Physic
Psychology
Real Estate
Science
Social Science
Sociology
Special Education
Speech
Visual Arts
Question
Use the following graph to answer the following questions.
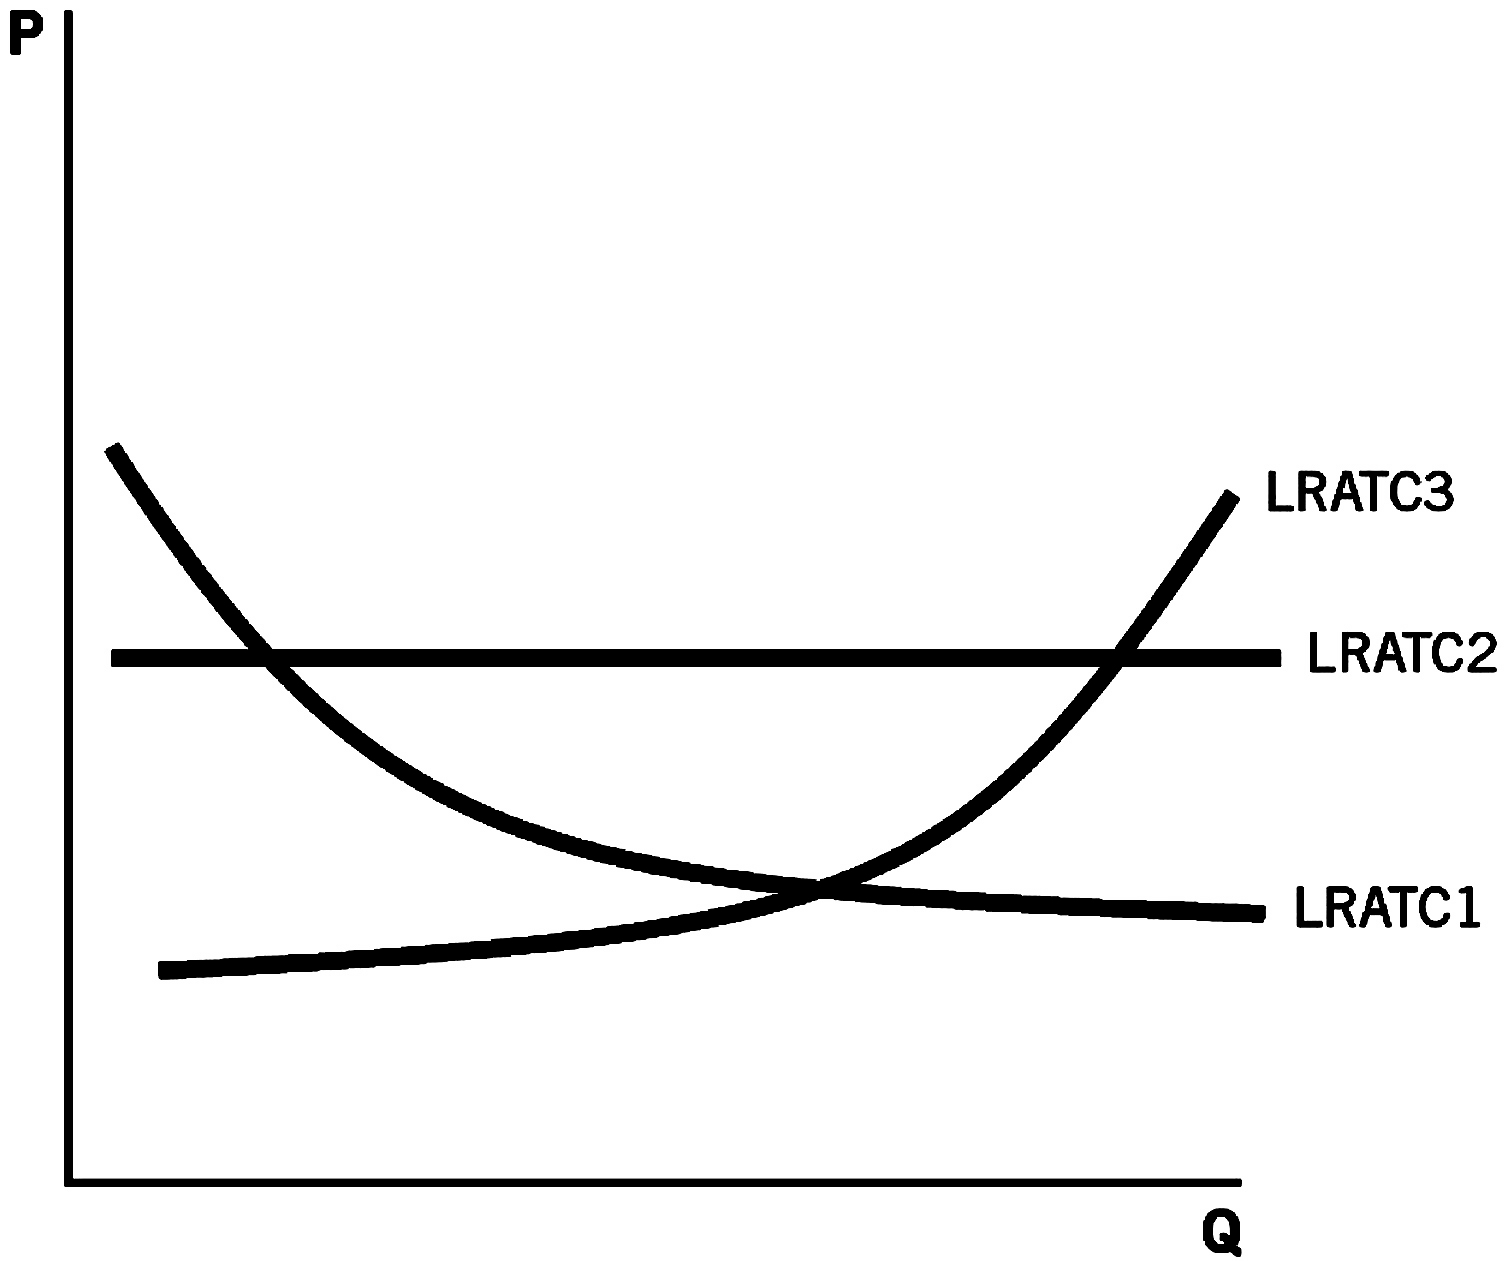
A firm expands its scale of production and finds that its long-run average total cost curve looks like LRATC3. It might look this way because the firm
a. is able to pay its employees less.
b. adds several additional layers of management, which increase its costs.
c. is able to reduce its tax burden.
d. is able to produce output more efficiently.
e. is able to sell more output.
Answer
This answer is hidden. It contains 59 characters.
Related questions
Q:
The city decides to offer a subsidy to each homeowners association that plants more flowers in their common areas. In the market for flowers, this will cause the
a. supply curve to shift to the left.
b. supply curve to shift to the right.
c. demand curve to shift to the left.
d. demand curve to shift to the right.
e. the supply curve to shift to the left and the demand curve to shift to the right.
Q:
The market works efficiently in the absence of externalities if the good is
a. rival and excludable.
b. nonrival and nonexcludable.
c. rival and nonexcludable.
d. nonrival and excludable.
e. rival and either excludable or nonexcludable.
Q:
A good that is nonrival and nonexcludable is defined as a ________ good.a. private b. public c. common-resourced. clube. government
Q:
Global warming is an example ofa. the tragedy of the commons. b. a public good. c. the club-good problem.d. a positive externality.e. a problem that has an easy solution.
Q:
Which rule would NOT protect fish populations?
a. limiting the length of the fishing season
b. limiting the number of fish that can be caught
c. not allowing female fish to be caught
d. not allowing young fish to be caught
e. catching any fish except males
Q:
The tragedy of the commons occurs for goods that area. rival and excludable. b. rival and nonexcludable. c. nonrival and nonexcludable.d. nonrival and excludable.e. never produced by the government.
Q:
The quantity produced of a common-resource good is likely to deviate from the socially optimal quantity because
a. common-resource goods are nonrival.
b. common-resource goods cannot be traded.
c. there is an incentive to overproduce the good.
d. of the free-rider problem.
e. positive externalities are likely to exist.
Q:
The ability to download music and movies from the Internet without paying is
a. an example of a negative externality.
b. an example of a club good.
c. an illegal form of free-riding.
d. an illustration of the tragedy of the commons.
e. something that anyone who pays taxes should be allowed to do.
Q:
The air is a ________ good.a. private b. public c. clubd. common-resourcee. government
Q:
Which of the following is the best example of a common-resource good?a. a fireworks display b. a lighthouse c. cable televisiond. fish in a lakee. the production of gasoline
Q:
If a store sells a good at the market price, even though the government authorities have set the minimum price that can be charged, the store is selling the good in a(n)
a. black market for a market price that is higher.
b. black market for a market price that is lower.
c. effort to eliminate a surplus of the good.
d. legal market for a market price that is higher.
e. legal market for a market price that is lower.
Q:
A market where exchanges occur despite price regulations is called a(n) ________ market.a. hidden b. noncompetitive c. blackd. prohibitede. outlaw
Q:
The Coase theorem suggests that private parties
a. will never be able to negotiate to correct a negative externality.
b. can always negotiate to correct a negative externality.
c. can negotiate to correct a negative externality if there are no barriers to negotiation.
d. can negotiate to correct a negative externality if the government passes a law allowing them to do so.
e. can never negotiate to correct a negative externality if there are more than two parties involved.
Q:
Clean air becomes polluted because
a. it is a private good.
b. no one owns the air.
c. it is a club good.
d. the air is owned by private corporations.
e. the air is owned by the government.
Q:
External benefits arise from the actions of
a. firms.
b. consumers.
c. firms and consumers.
d. the government.
e. firms, consumers, and the government.
Q:
What makes an externality positive rather than negative?
a. The deadweight loss is greater than zero, not less.
b. The socially optimal quantity exchanged is less, not greater, than at market equilibrium.
c. The externality affects the demand curve rather than the supply curve.
d. The externality benefits third parties rather than harming them.
e. The externality becomes internalized without government action.
Q:
Consider the accompanying figure to answer the following questions.When a positive externality exists, which point best identifies the social optimum?a. A b. B c. Cd. De. either A or D
Q:
When people elect to spend more years in school, this results in a ________ externality because there are ________ associated with this decision.a. negative; internal costs b. negative; external costs c. positive; external benefitsd. positive; external costse. positive; internal benefits
Q:
The government imposes a tax on the sale of a good whose production is creating a negative externality. The value of the tax is $4 per unit sold. In the new equilibrium, we would expect
a. the same amount to be sold and the price to be $4 higher.
b. the same amount to be sold and the price to increase by less than $4.
c. less to be sold and the price to increase by $4.
d. less to be sold and the price to increase by less than $4.
e. less to be sold and the price to increase by more than $4.