Accounting
Anthropology
Archaeology
Art History
Banking
Biology & Life Science
Business
Business Communication
Business Development
Business Ethics
Business Law
Chemistry
Communication
Computer Science
Counseling
Criminal Law
Curriculum & Instruction
Design
Earth Science
Economic
Education
Engineering
Finance
History & Theory
Humanities
Human Resource
International Business
Investments & Securities
Journalism
Law
Management
Marketing
Medicine
Medicine & Health Science
Nursing
Philosophy
Physic
Psychology
Real Estate
Science
Social Science
Sociology
Special Education
Speech
Visual Arts
Question
Use the following information to answer the following questions.
The following graph depicts a market where a tax has been imposed. Pe was the equilibrium price before the tax was imposed, and Qe was the equilibrium quantity. After the tax, PC is the price that consumers pay, and PS is the price that producers receive. QT units are sold after the tax is imposed. NOTE: The areas B and C are rectangles that are divided by the supply curve ST. Include both sections of those rectangles when choosing your answers.
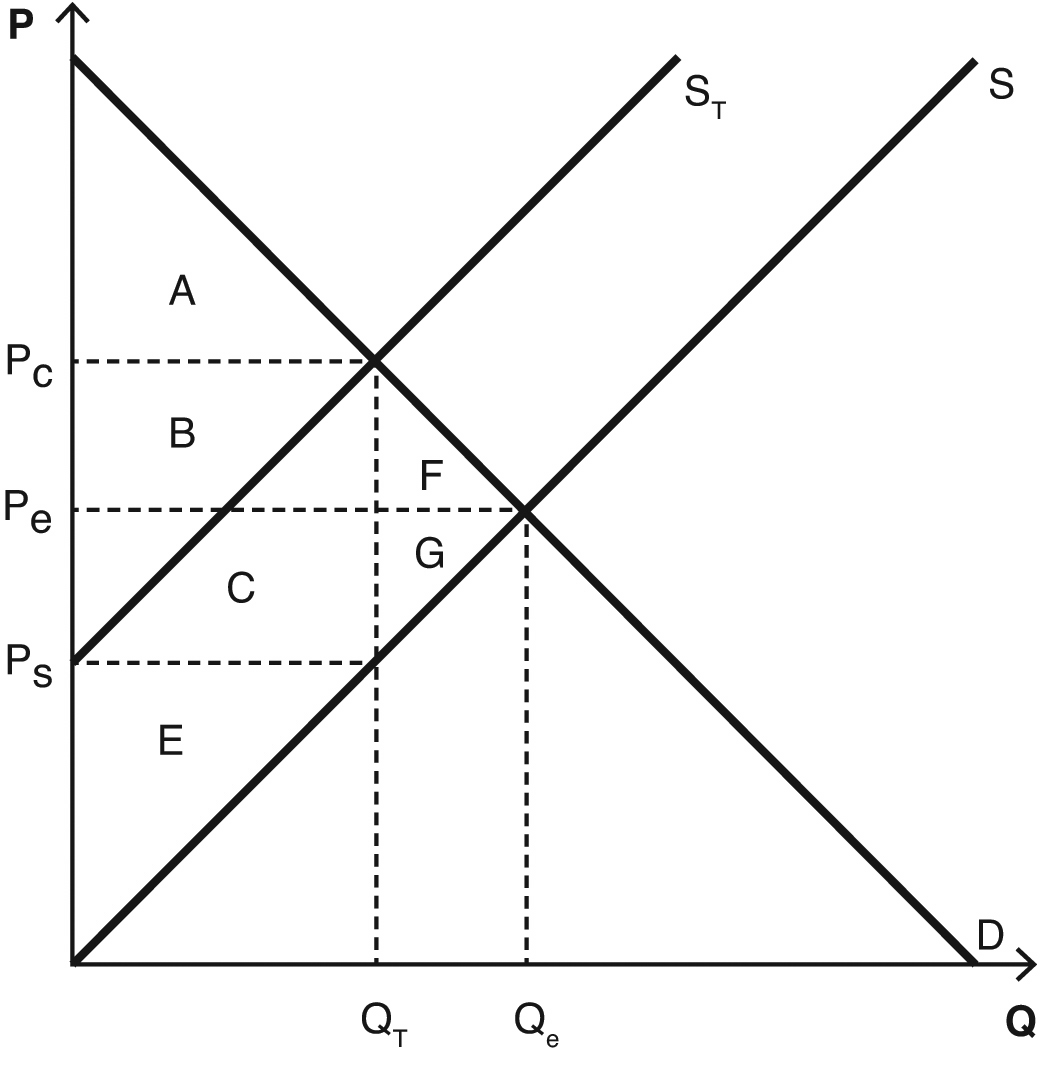
Which areas represent the deadweight loss created as a result of the tax?
a. A + B + C + E + F + G
b. A + C
c. A + B + C + E
d. F + G
e. B + C + F + G
Answer
This answer is hidden. It contains 55 characters.